China Silk Products Trade Statistics – January and February 2025
Table of Contents
In the previous article, we analyzed the import and export trade data of silk products in the United States in January 2025. Friends who are interested can click USA’s data to learn more. In today’s article, brought to you by Docsun Home and Living, we will focus on analyzing China’s silk product trade data from January to February 2025.
According to customs statistics, the total import and export value of China’s silk products from January to February was USD 259 million, a year-on-year decrease of 12.26%, accounting for 0.56% of China’s total textile and apparel import and export value. Among them, exports amounted to USD 217 million, a decrease of 8.72%, accounting for 0.51% of all the textile and apparel exports. Imports totaled USD 41.64 million, a decline of 27.06%, accounting for 1.40% of all the textile and apparel imports.
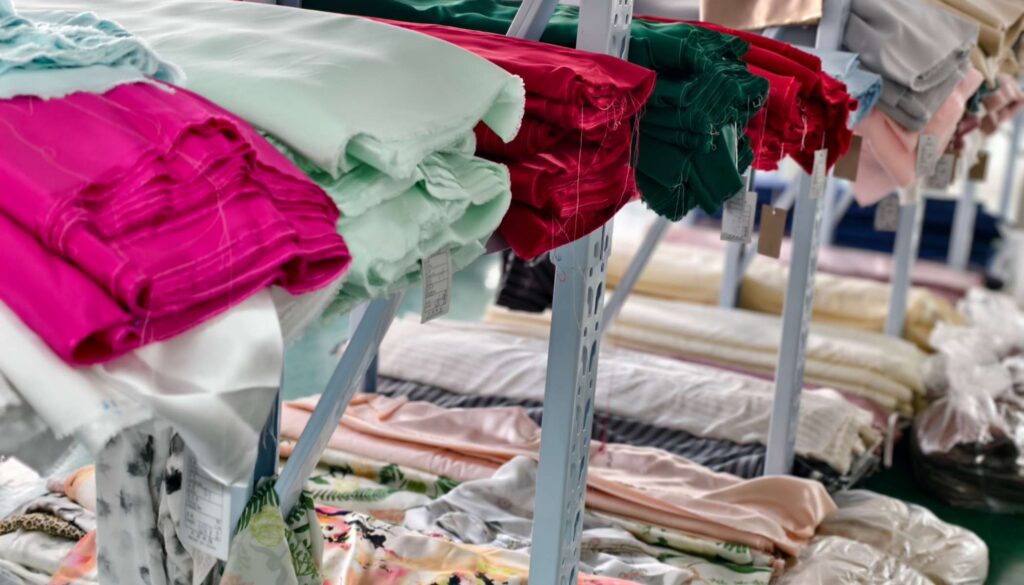
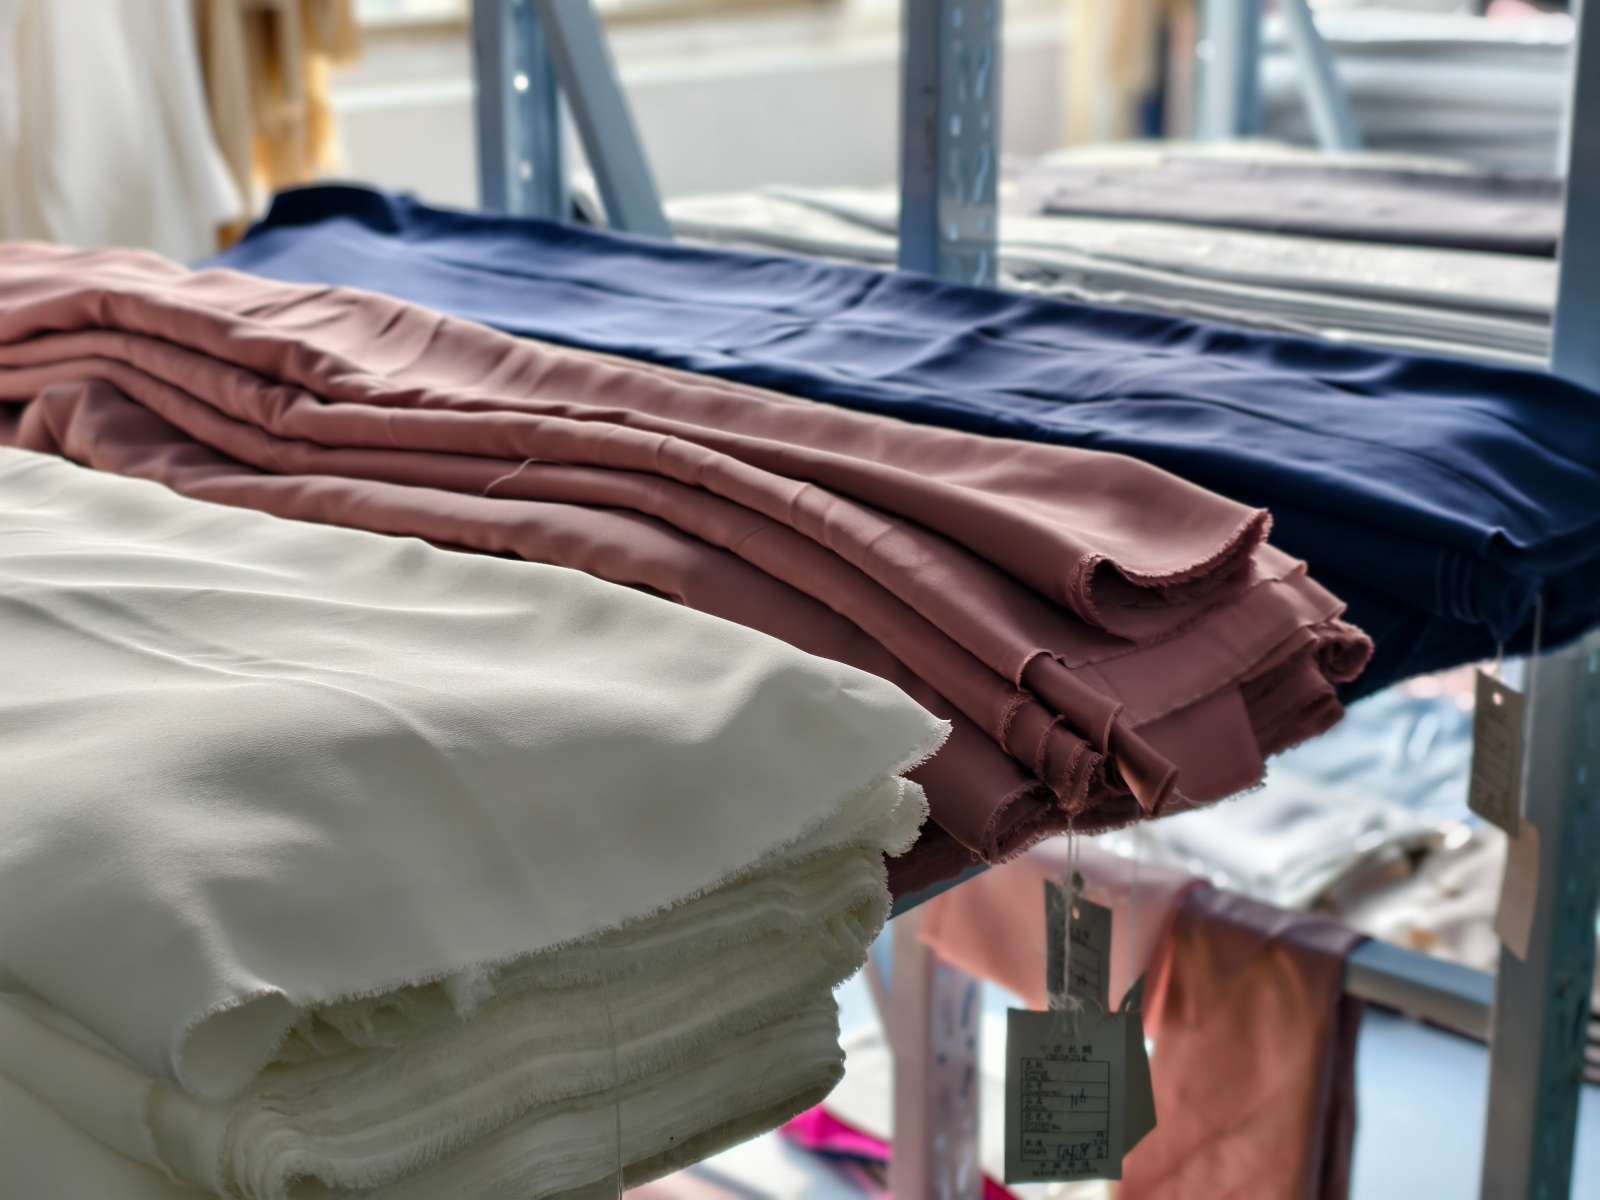
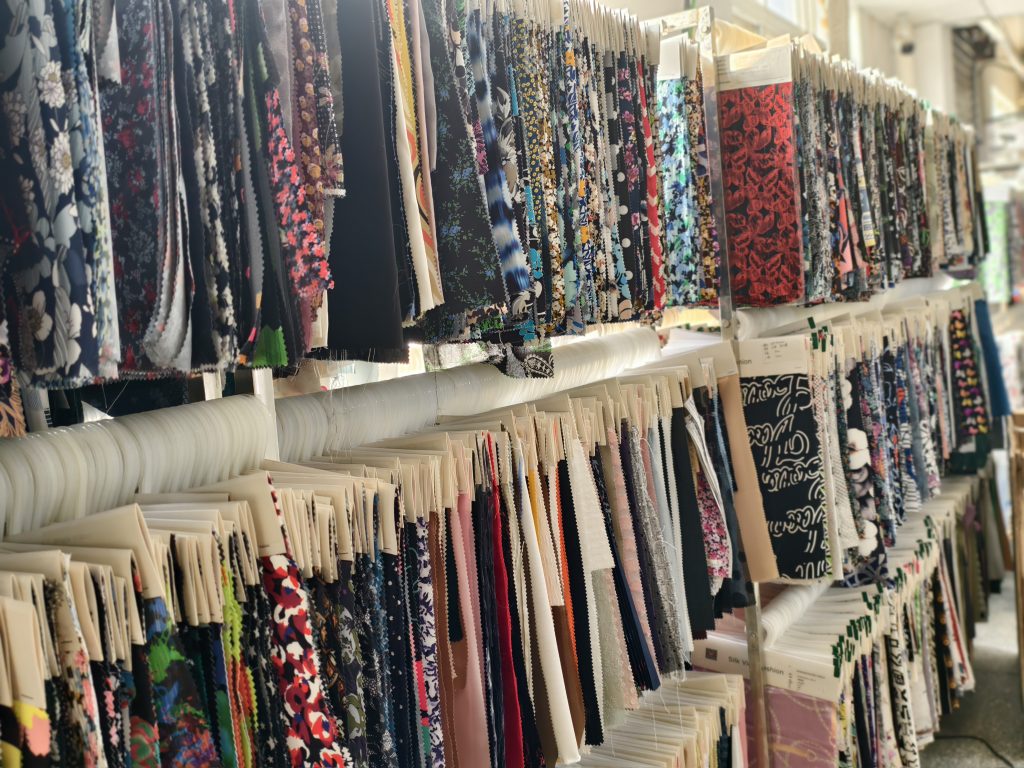 Figure 1: Overview of China’s Silk Manufacturing Capability
I. Export Statistics
Table 1: Export Value of All China’s Silk Products to Major Markets (Jan-Feb 2025)
Unit: 10,000 USD
| Rank | Partner Country/Region | Export Value | Market Share (%) | YoY Change (%) |
| — | Global | 21743.03 | 100.00 | -8.72 |
| 1 | EU (27) | 6884.49 | 31.66 | -1.40 |
| 2 | USA | 4314.52 | 19.84 | -17.38 |
| 3 | India | 1458.77 | 6.71 | -19.84 |
| 4 | Japan | 1061.48 | 4.88 | -13.52 |
| 5 | UK | 751.11 | 3.45 | 21.07 |
| 6 | Sri Lanka | 642.43 | 2.95 | 12.24 |
| 7 | Vietnam | 601.47 | 2.77 | -8.98 |
| 8 | South Korea | 590.52 | 2.72 | -16.75 |
| 9 | Hong Kong | 560.33 | 2.58 | -45.09 |
| 10 | Australia | 474.07 | 2.18 | -39.18 |
Table 2: Export Value of China’s Raw Silk and Yarn to Major Markets (Jan-Feb 2025)
Unit: 10,000 USD
| Rank | Partner Country/Region | Export Value | Market Share (%) | YoY Change (%) |
| — | Global | 6245.98 | 100.00 | 0.22 |
| 1 | EU (27) | 3002.72 | 48.07 | 8.37 |
| 2 | India | 887.60 | 14.21 | -28.39 |
| 3 | Japan | 465.19 | 7.45 | -4.06 |
| 4 | Vietnam | 349.82 | 5.60 | -17.85 |
| 5 | Pakistan | 230.79 | 3.69 | 42.23 |
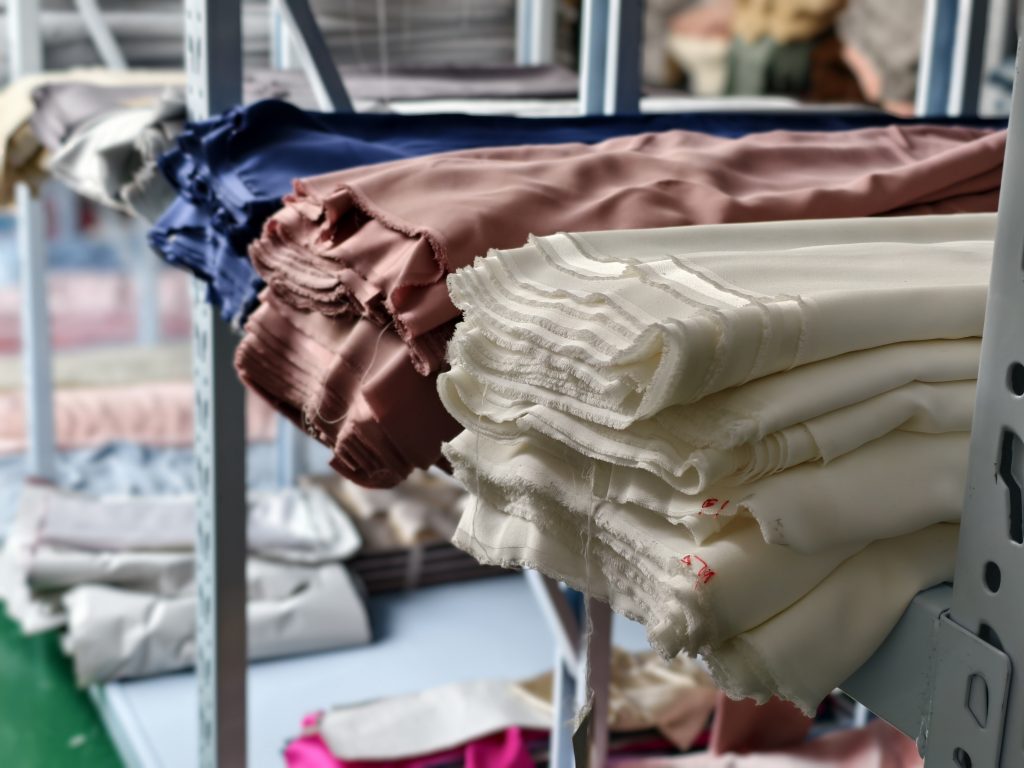 High-quality raw silk production for export markets.
Table 3: Export of China’s Raw Silk and Yarn by Volume and Unit Price to Major Markets (Jan-Feb 2025)
Unit: Tons, Unit Price: USD/kg
| Rank | Country/Region | Export Volume | YoY Change (%) | Share (%) | Unit Price (USD/kg) | YoY Change (%) |
| — | Global | 1137.49 | 4.06 | 100.00 | 54.91 | -3.69 |
| 1 | EU (27) | 510.61 | 12.59 | 44.89 | 58.81 | -3.75 |
| 2 | India | 152.55 | -27.90 | 13.41 | 58.18 | -0.68 |
| 3 | Japan | 81.06 | -14.74 | 7.13 | 57.39 | 12.53 |
| 4 | Vietnam | 60.34 | -22.94 | 5.30 | 57.97 | 6.60 |
Table 4: Export Value of China’s Silk Fabrics to Major Markets (Jan-Feb 2025)
Unit: 10,000 USD
China remains a dominant player in silk fabrics. For businesses looking to leverage these materials, we offer professional custom printing services to create unique designs on high-quality Chinese silk.
| Rank | Partner Country/Region | Export Value | Market Share (%) | YoY Change (%) |
| — | Global | 5477.25 | 100.00 | -1.24 |
| 1 | EU (27) | 1584.47 | 28.93 | 11.92 |
| 2 | Sri Lanka | 641.75 | 11.72 | 12.20 |
| 3 | India | 549.81 | 10.04 | -1.91 |
| 4 | Turkey | 370.94 | 6.77 | 31.67 |
| 5 | Vietnam | 243.92 | 4.45 | 15.75 |
Table 5: Export Value of China’s Silk Finished Products to Major Markets (Jan-Feb 2025)
Unit: 10,000 USD
Finished products such as scarves are vital to the export economy. Explore our extensive scarf collection or view our scarf custom cases to see how we help brands succeed.
| Rank | Partner Country/Region | Export Value | Market Share (%) | YoY Change (%) |
| — | Global | 10019.81 | 100.00 | -16.79 |
| 1 | USA | 4013.43 | 40.05 | -18.31 |
| 2 | EU (27) | 2297.29 | 22.93 | -17.83 |
| 3 | UK | 638.40 | 6.37 | 21.81 |
| 4 | Japan | 464.03 | 4.63 | -17.86 |
| 5 | Australia | 453.38 | 4.52 | -37.66 |
Table 6: Export Value of Silk Products from Major Provinces and Cities in China (Jan-Feb 2025)
Unit: 10,000 USD
| Rank | Province | Export Value | Share (%) | YoY Change (%) |
| — | Total | 21743.03 | 100.00 | -8.72 |
| 1 | Zhejiang | 7999.70 | 36.79 | -8.84 |
| 2 | Jiangsu | 4239.81 | 19.50 | -14.88 |
| 3 | Guangdong | 2153.48 | 9.90 | -6.01 |
| 4 | Shanghai | 1471.79 | 6.77 | -25.26 |
| 5 | Shandong | 1428.48 | 6.57 | -3.01 |
2. Import Statistics
Table 7: Import Value of All the Silk Products from Major Sources to China (Jan-Feb 2025)
Unit: 10,000 USD
| Rank | Partner Country/Region | Import Value | Share (%) | YoY Change (%) |
| — | Global | 4164.15 | 100.00 | -27.06 |
| 1 | EU (27) | 2847.02 | 68.37 | -27.73 |
| 2 | India | 395.73 | 9.50 | -42.12 |
| 3 | Uzbekistan | 258.94 | 6.22 | -36.55 |
| 4 | China | 146.21 | 3.51 | -38.56 |
Table 8: Import Value of China’s Raw Silk and Yarn from Major Sources (Jan-Feb 2025)
Unit: 10,000 USD
| Rank | Partner Country/Region | Import Value | Share (%) | YoY Change (%) |
| — | Global | 846.35 | 100.00 | -33.16 |
| 1 | India | 351.69 | 41.55 | -45.84 |
| 2 | Uzbekistan | 251.89 | 29.76 | -38.28 |
| 3 | North Korea | 88.14 | 10.41 | 48.60 |
Table 9: Import of China’s Raw Silk and Yarn by Volume and Unit Price from Major Sources (Jan-Feb 2025)
Unit: Tons, Unit Price: USD/kg
| Rank | Country/Region | Import Volume | YoY Change (%) | Share (%) | Unit Price (USD/kg) | YoY Change (%) |
| — | Global | 845.67 | -34.15 | 100.00 | 10.01 | 1.50 |
| 1 | India | 311.81 | -49.20 | 36.87 | 11.28 | 6.61 |
| 2 | Uzbekistan | 293.14 | -30.34 | 94.01 | 8.59 | -11.40 |
| 3 | North Korea | 129.46 | 17.73 | 44.17 | 6.81 | 26.22 |
Table 10: Import Value of China’s Silk Fabrics from Major Sources (Jan-Feb 2025)
Unit: 10,000 USD
| Rank | Partner Country/Region | Import Value | Market Share (%) | YoY Change (%) |
| — | Global | 196.53 | 100.00 | -12.06 |
| 1 | EU (27) | 66.94 | 34.06 | -28.41 |
| 2 | Myanmar | 44.48 | 22.63 | 51.02 |
| 3 | Switzerland | 26.45 | 13.46 | -21.45 |
Table 11: Import Value of China’s Silk Finished Products from Major Sources (Jan-Feb 2025)
Unit: 10,000 USD
| Rank | Partner Country/Region | Import Value | Market Share (%) | YoY Change (%) |
| — | Global | 3121.26 | 100.00 | -26.03 |
| 1 | EU (27) | 2759.28 | 88.40 | -27.74 |
| 2 | China | 114.13 | 3.66 | -46.23 |
| 3 | India | 40.63 | 1.30 | 27.60 |
Table 12: Import Value of All Silk Products to Major Provinces and Cities in China (Jan-Feb 2025)
Unit: 10,000 USD
| Rank | Province | Import Value | Share (%) | YoY Change (%) |
| — | Total | 4164.15 | 100.00 | -27.06 |
| 1 | Shanghai | 2944.83 | 70.72 | -26.63 |
| 2 | Zhejiang | 503.56 | 12.09 | -46.67 |
| 3 | Guangdong | 240.59 | 5.78 | -0.67 |

